
Programėlės
Hours spend using social media
Social media is a digital technology that allows the sharing of ideas and information, including text and visuals, through virtual networks and communities. What started out in early 2000s as a way for people to interact with friends and family soon expanded to a world wide addiction that can lead to an increased risk for depresion, anxiety, loneliness or even self-harm.
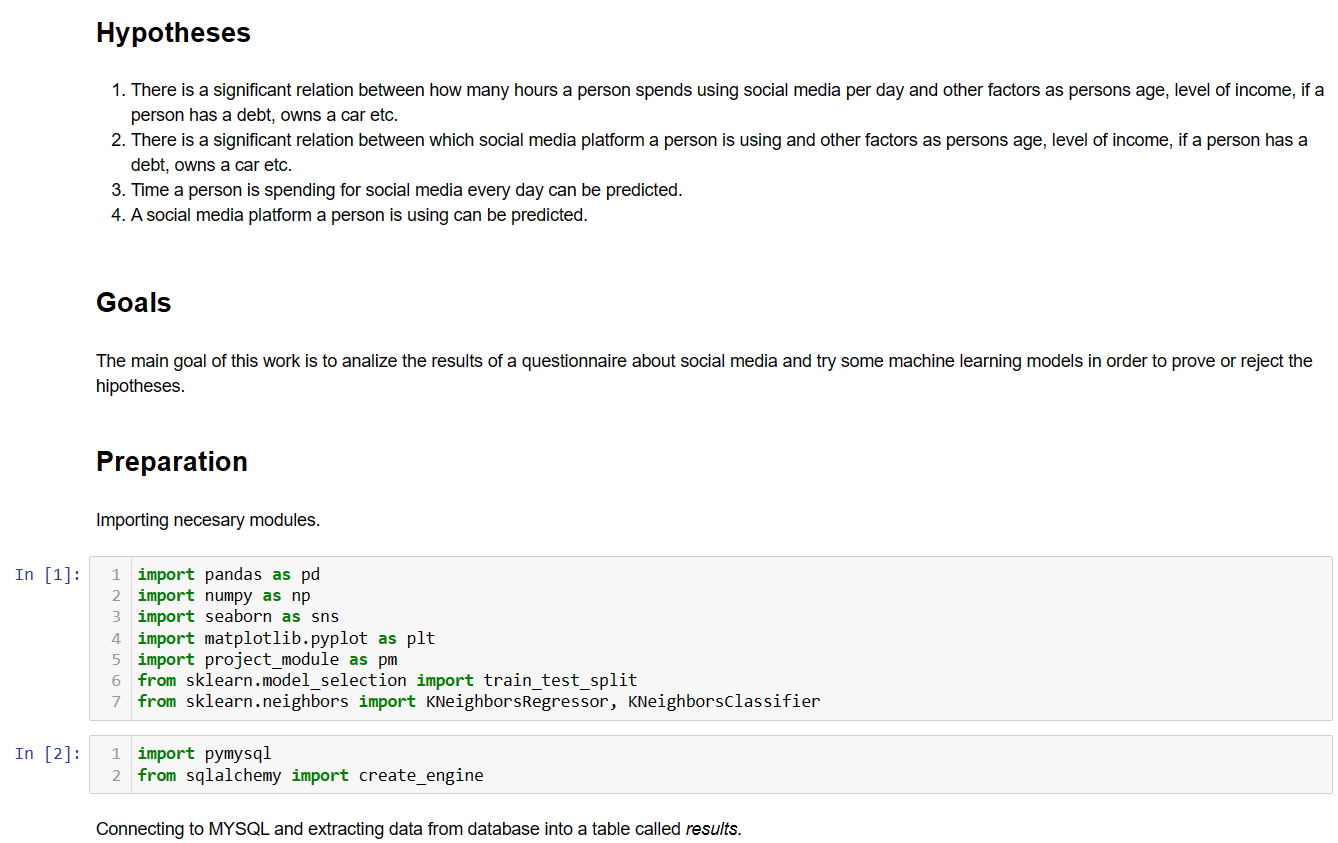
Hypotheses
There is a significant relation between how many hours a person spends using social media per day and other factors as persons age, level of income, if a person has a debt, owns a car etc.
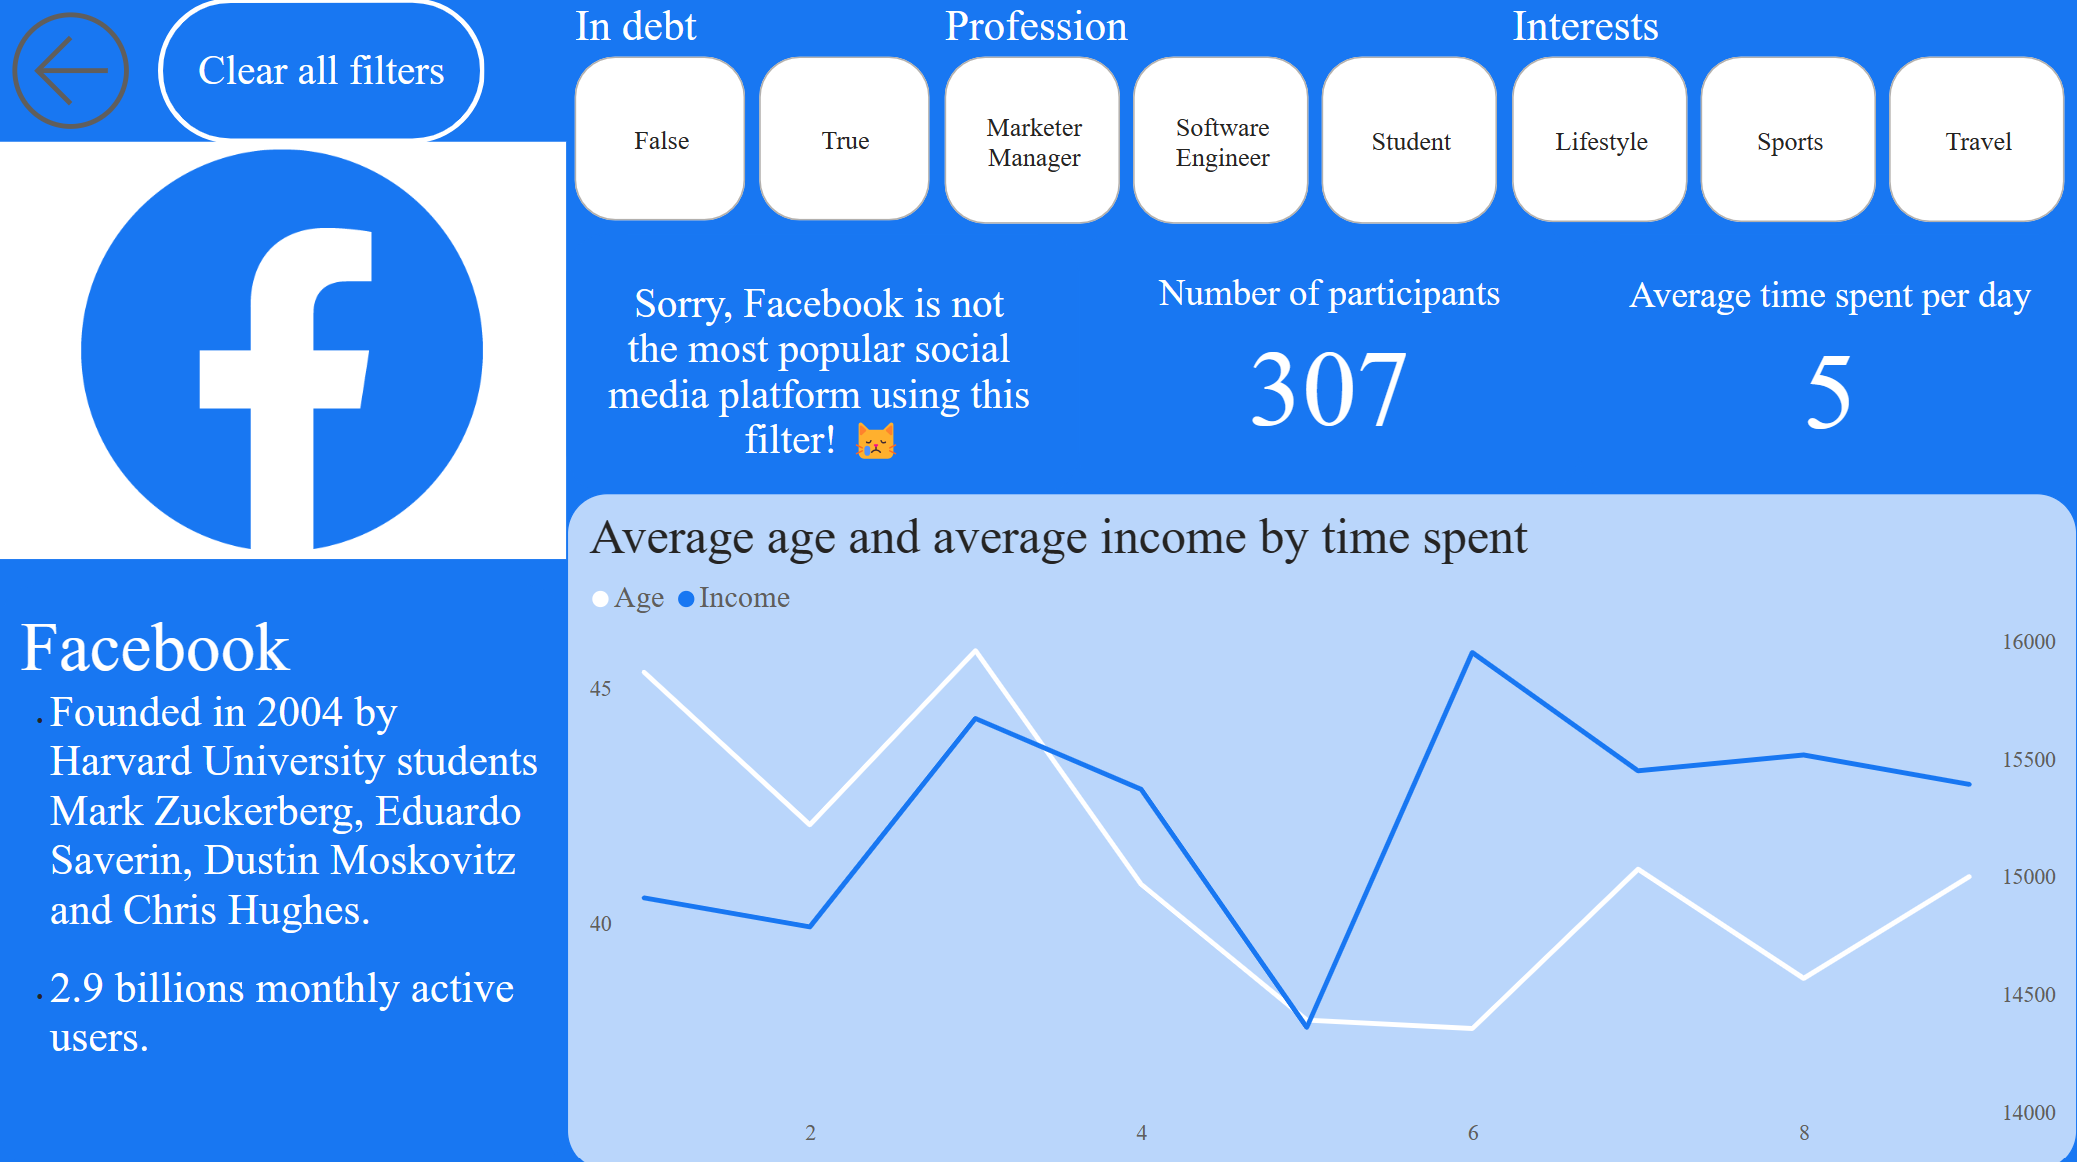
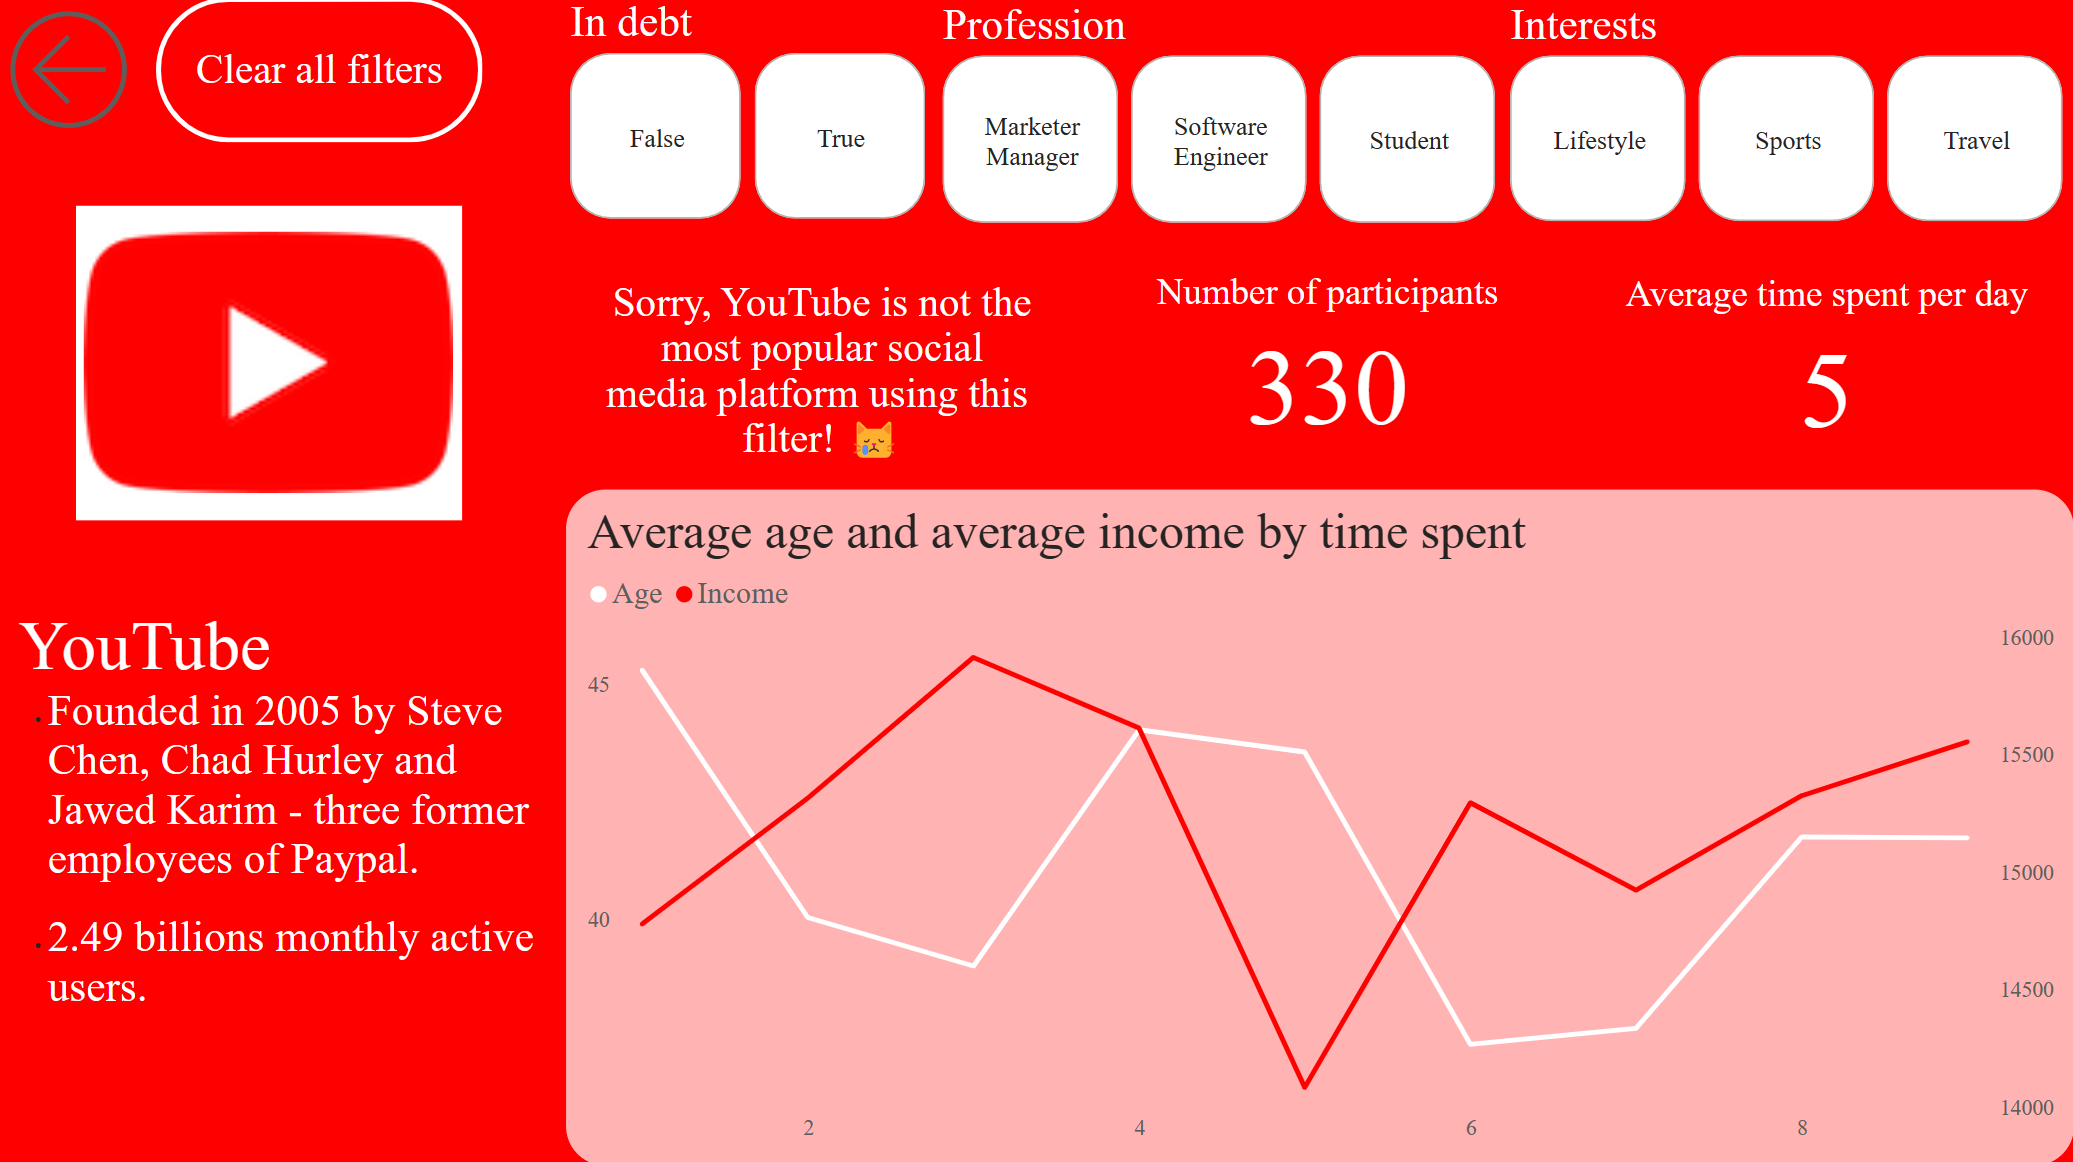
There is a significant relation between which social media platform a person is using and other factors as persons age, level of income, if a person has a debt, owns a car etc.
Time a person is spending for social media every day can be predicted.
A social media platform a person is using can be predicted.
Goals
The main goal of this work is to analize the results of a questionnaire about social media and try some machine learning models in order to prove or reject the hypotheses.
Preparation
Importing necessary modules.
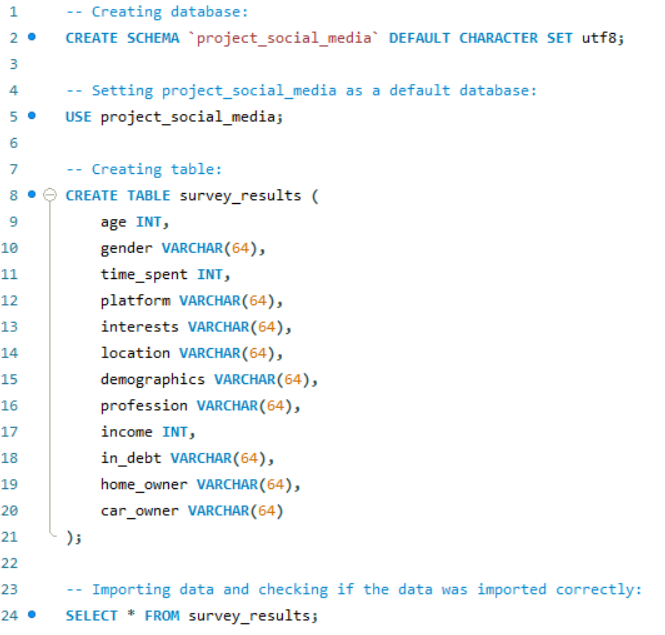
Connecting to MYSQL and extracting data from database into a table called results.
Correcting typo in the table.
All the data types are correct, except the three last columns that should be type Boolean. They will be changed into numbers at the next step, therefore I am leaving them as type object.
Preparing table for counting correlation
To include as many columns as possible into counting correlation, values True and False in columns in_debt, home_owner and car_owner are replaced by numbers. Also values in column platform are updated by replacing value "Facebook" with 1, value "Instagram" with 2 and value "YouTube" with 3. Values are replaced by using my created function updating_data which provided by column that needs to be updated, old and new values repeats replace method until all the changes are made.
Cleaning data by removing values that do not fall in range [Q1 - 1.5IQR; Q3 + 1.5IQR], where IQR is Q3 - Q1. Data is cleaned by using my created function data_cleaning.
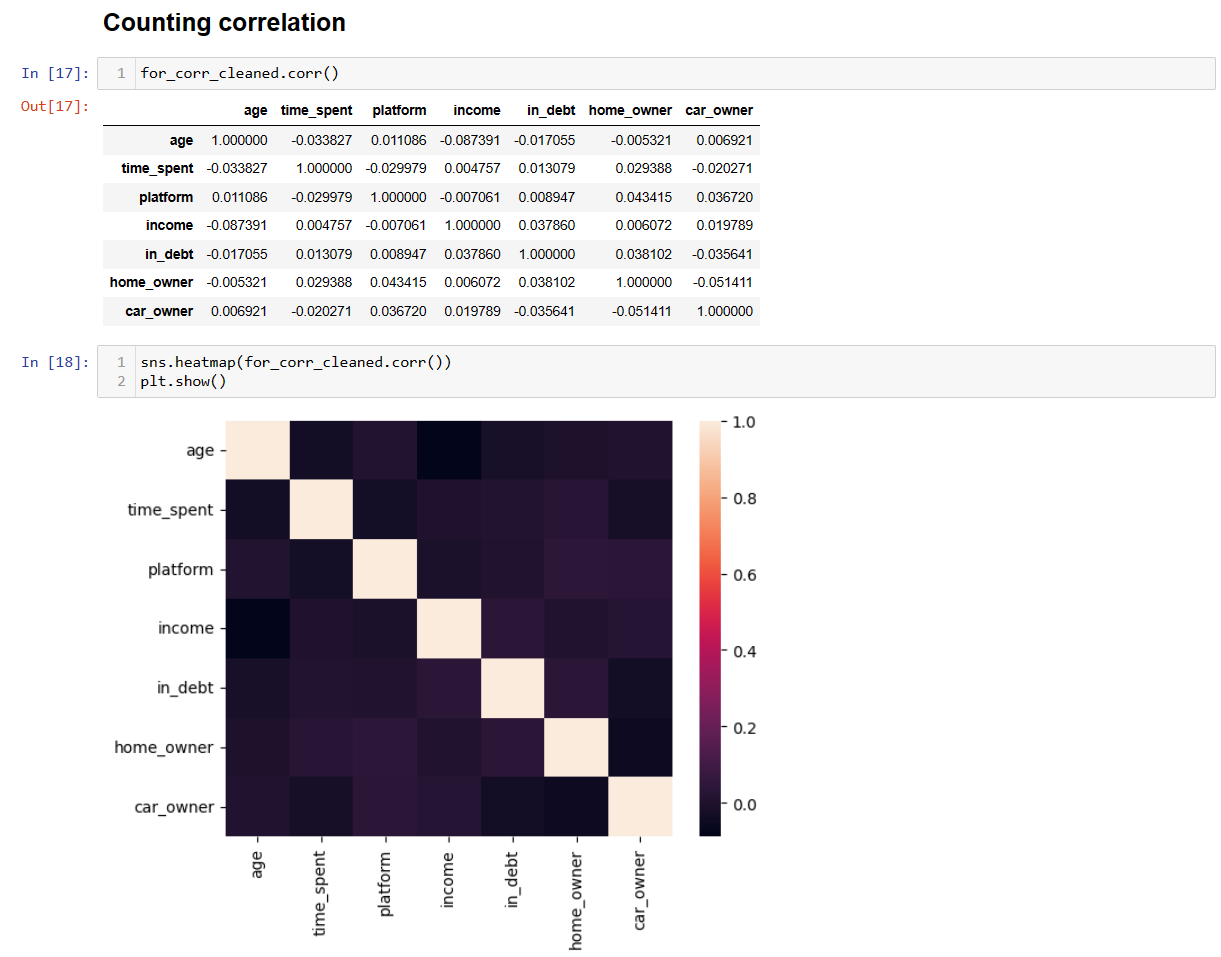
Counting correlation
As correlation coefficient never exceeds 0.3, correlation can be called negligible.
Using K-Neighbour Regression and K-Neighbour Classifier models
Checking data distribution.
Checking if KNN Regression model would fit to predict time_spent values with age as independent values.
Creating a graph for data from questionnaire and KNN Regression prediction.
R^2 score is less then zero, predicted values are with type Float even though all the provided data is type Integer.
Trying KNN Classifier model for the same columns.
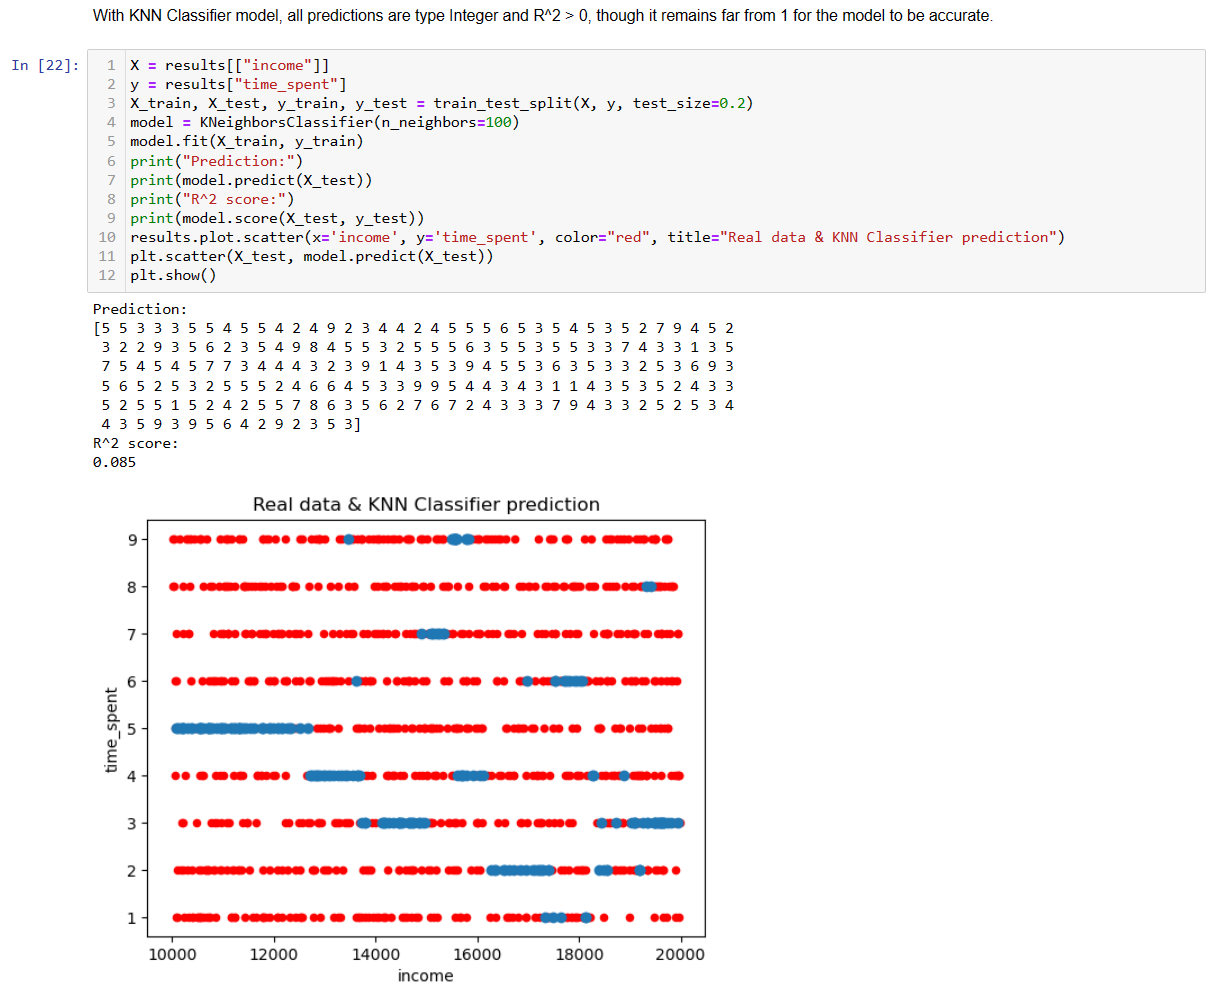
With KNN Classifier model, all predictions are type Integer and R^2 > 0, though it remains far from 1 for the model to be accurate.
KNN Classifier model with income as independent values show R^2 score 0.085.
To predict platform, using KNN Classifier model again.
With age as independent values KNN Classifier model is showing higher R^2 results than with income.
Conclusions
Hypotheses 1 and 2 were not confirmed. The data from questionnaire results did not allow to see any significant correlation.
K-Neighbours Regression model did not fit for predicting time spent using social media per day with R^2 value being less then zero.
K-Neighbours Classifier model showed better results, still not high enough for the predictions to be trusted. Therefore hipotheses 3 and 4 were also rejected.